Debugging Kiali
How to debug Kiali using traces.
Kiali provides the ability to emit debugging traces to the distributed tracing platform, Jaeger or Grafana Tempo.
From Kiali 1.79, the feature of Kiali emitting tracing data into Jaeger format has been removed.
The traces can be sent in HTTP, HTTPS or gRPC protocol. It is also possible to use TLS. When tls_enabled is set to true, one of the options skip_verify or ca_name should be specified.
The traces are sent in OTel format, indicated in the collector_type setting.
server:
  observability:
    tracing:
      collector_type: "otel"
      collector_url: "jaeger-collector.istio-system:4317"
      enabled: false
      otel:
        protocol: "grpc"
        tls_enabled: true
        skip_verify: false
        ca_name: "/tls.crt"
Usually, the tracing platforms expose different ports to collect traces in distinct formats and protocols:
- The Jaeger collector accepts OpenTelemetry Protocol over HTTP (4318) and gRPC (4317).
- The Grafana Tempo distributor accepts OpenTelemetry Protocol over HTTP (4318) and gRPC (4317). It can be configured to accept TLS.
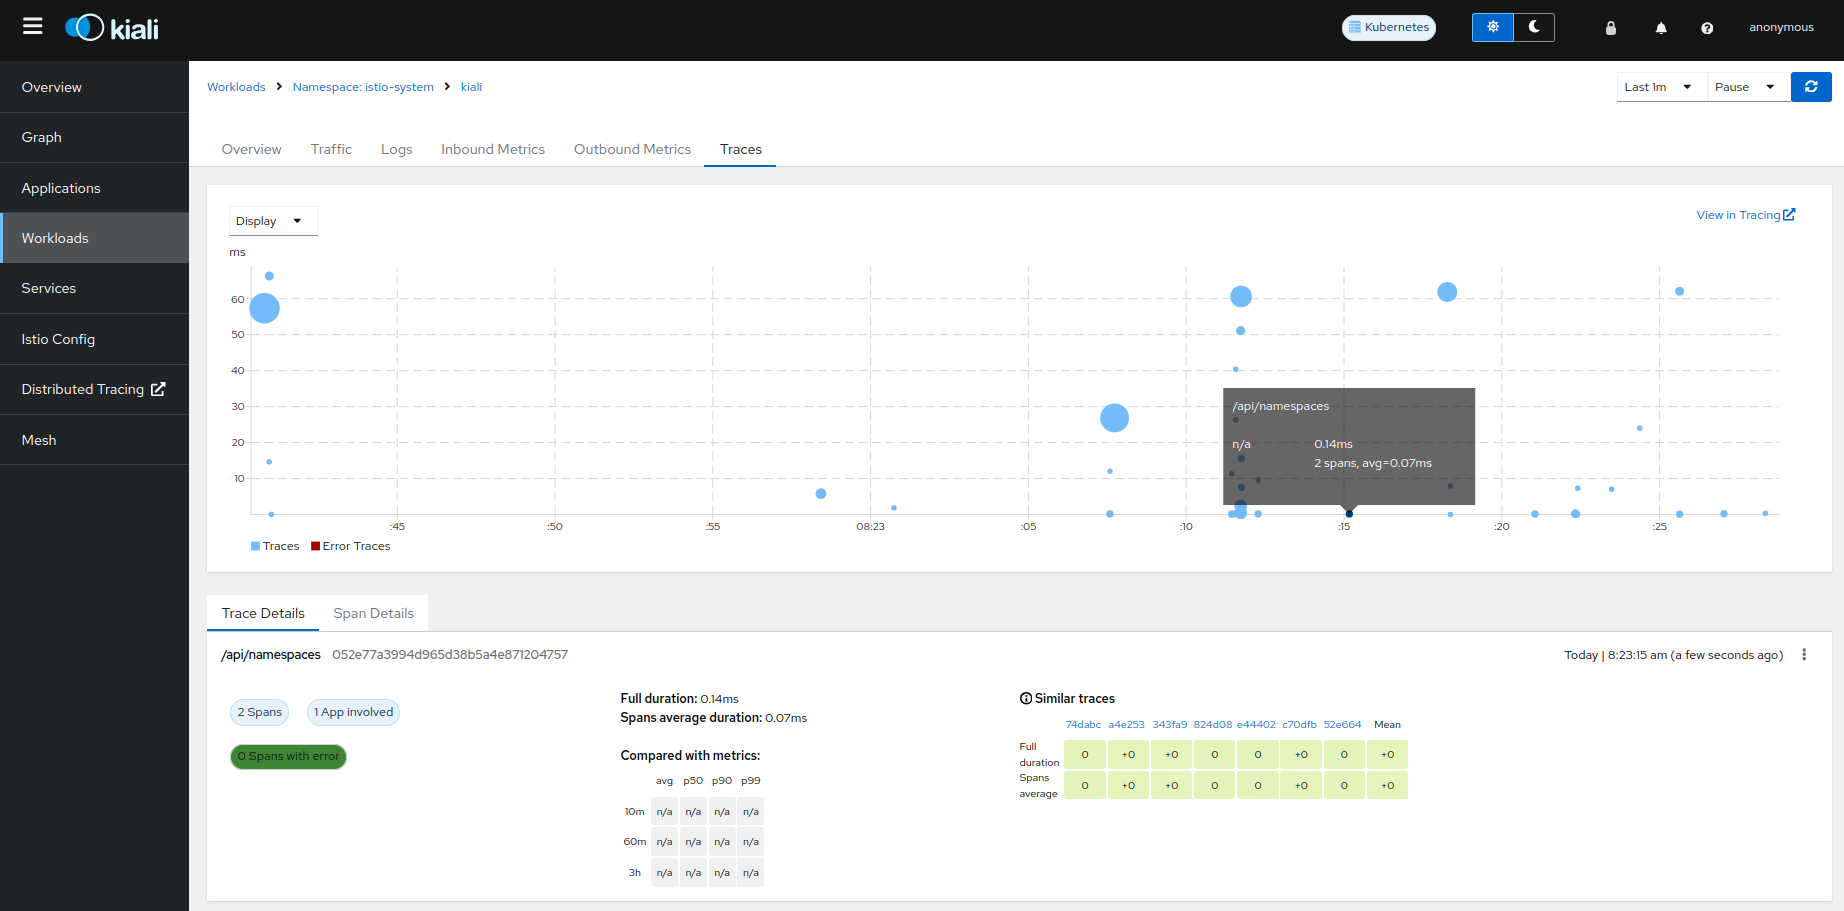
The traces emitted by Kiali can be searched in the Kiali workload:

Last modified January 19, 2024: update debugging Kiali content (#747) (7f408ce)